Uruguay emerged as a compelling case study in managing the COVID-19 pandemic through a mix of strong governance, scientific collaboration, and public transparency. The platform provided by UMAD enables deep insights into national and international pandemic trends, offering real-time comparisons, mobility patterns, and governmental interventions. These insights not only reflect Uruguay’s internal data collection but also integrate with global datasets to frame the country’s efforts in a broader international context. By focusing on cumulative cases, recoveries, testing, ICU occupancy, and mobility trends, the information portal supports effective analysis for public health strategy and future epidemic preparedness.
Table of Contents
COVID-19 Data Trends and Indicators in Uruguay
National COVID-19 Database
Developed by UMAD using structured global data and local inputs.
Includes statistics on cases, deaths, ICU usage, testing, recoveries, and mobility.
Features real-time graphs and comparative analytics across countries and regions.
Data Sources
Local: Official government reports, Pasteur Institute monitor.
Global: Integrated datasets from structured international repositories.
Key COVID-19 Indicators in Uruguay
Indicator
Description
Accumulated Confirmed Cases
Records all confirmed positive COVID-19 cases since early April. Earlier records were unreliable and thus omitted.
Active Infections
Derived by subtracting recoveries and deaths from total cases. This metric estimates current virus presence in the community.
Recovered Cases
Includes all patients discharged after 14 symptom-free days. Testing for discharge is limited to priority cases.
Deaths Due to COVID-19
Reflects confirmed deaths. Due to varying international classification criteria, data may not always represent all COVID-related fatalities.
Daily Infections
Counts individuals who received positive test results per day. This may not correspond with actual infection dates due to result delays.
Daily Deaths
Provides the number of confirmed COVID-19-related deaths recorded each day. This is not cumulative.
ICU Admissions
Captures the daily number of critical cases in intensive care due to COVID-19 complications.
Tests Conducted Per Day
Measures the number of tests processed each day, with delays between swab and result impacting interpretation.
Total Tests to Date
Shows the overall count of COVID-19 tests conducted nationwide.
Growth Rate of Total Cases
Reflects the percentage change in confirmed cases day-by-day. A decline indicates possible control of transmission.
Recovery vs Total Cases Ratio
Compares cumulative recoveries to total confirmed cases. The closer this value is to zero, the more controlled the outbreak.
Mobility and Public Health Response
Mobility Patterns
Google Mobility Reports provided real-time behavioral data.
Covered areas such as parks, workplaces, recreational spots, transit stations, and residential zones.
Offered indirect measurement of population compliance with restrictions and potential hotspots for virus spread.
Government Measures
Rapid response from Uruguay’s government included:
Border closures.
Remote work mandates.
Suspension of in-person classes.
Support for at-risk populations.
Phased reopening strategies were guided by active infection and ICU data.
Area
Observed Mobility Trend
Workplaces
Decline in early stages, gradual increase with reopening.
Parks and Recreation
Initial sharp decrease, followed by weekend surges.
Transit Stations
Marked drop, correlated with travel restrictions.
Residential
Increase in time spent at home, consistent with lockdown.
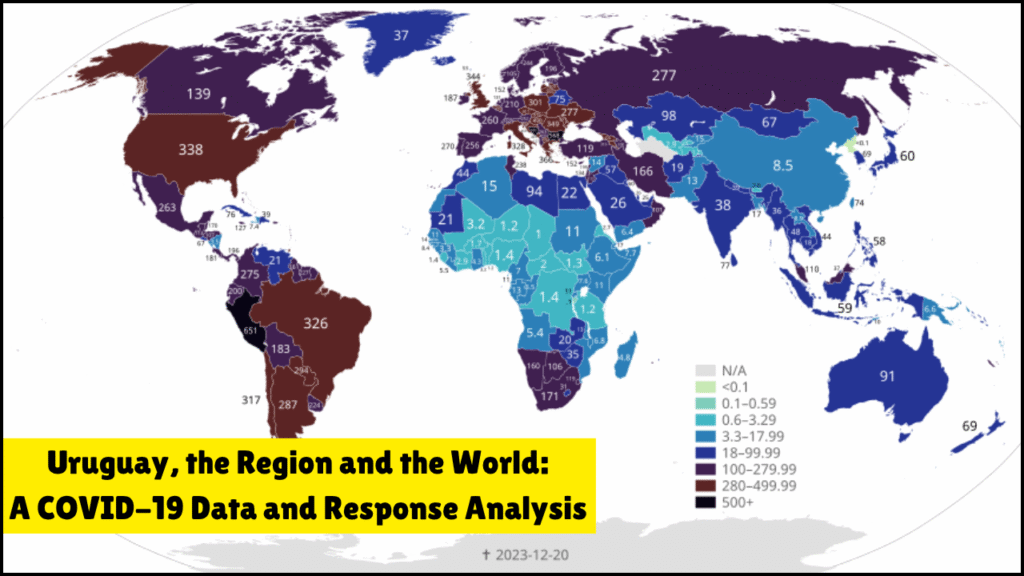
Comparative Global Analysis
Cross-national Benchmarks
Uruguay’s metrics were compared with Latin American countries and select global regions.
Lower death and ICU admission rates distinguished Uruguay from many peers.
Testing Capacity
Uruguay increased daily testing over time.
Applied strategic mass testing in vulnerable populations and hotspots.
Country
Testing per 1,000
Case Fatality Rate (CFR)
ICU Rate per Case
Uruguay
High
Low
Moderate
Brazil
Moderate
Higher
High
Argentina
Moderate
Moderate
High
Germany
High
Low
Moderate
Interpreting Epidemic Trends in Uruguay
Active vs. Recovered
A rising number of recoveries and a consistent decline in active cases indicated effective containment.
Sustained negative change in active infections reflected controlled transmission.
Recovered vs. Deaths
The increasing gap between recoveries and deaths marked a positive trajectory.
Uruguay’s recovery-to-death ratio remained among the best in the region.
Indicator
Trend Direction
Interpretation
Recovered Cases
Upward
Indicates improved treatment outcomes.
Daily Deaths
Stable/Declining
Suggests better ICU and triage responses.
Growth Rate of New Cases
Downward
Sign of effective interventions and testing.
Epidemiological Modeling and Limitations
Excess Mortality Analysis
Uruguay lacked access to comprehensive death records for 2018 and 2019.
Absence of this baseline hindered the full understanding of excess mortality.
Real Prevalence Estimations
Suggested for advanced users: consult methodological studies included on the platform.
Prevalence models take into account unreported or undetected cases.
Data Interpretation Caveats
Testing and reporting delays can cause daily data to reflect infections from up to 9 days earlier.
Discharge practices without testing may skew recovery numbers.
Recommended Analysis Tools and Resources
Resource
Use
EuroMomo
Tracks excess mortality trends across Europe. Useful for comparing death surges.
Google Mobility Reports
Monitors public movement and adherence to restrictions.
UMAD Methodology Section
Provides modeling resources and assumptions for estimating true infection and fatality rates.
Integrated Comparative Dashboards
Allow side-by-side comparison between Uruguay and other nations.
Final Thoughts
Uruguay’s COVID-19 monitoring platform offers an insightful blend of national data, global comparison, and dynamic visualizations. By combining government data with international resources and scientific analysis, the system supports transparent public communication and informed decision-making. Metrics such as recovery trends, active cases, testing capacity, and ICU usage provide reliable indicators for pandemic management. Despite some limitations in historical mortality data, Uruguay’s approach stands as a model of coordinated public health response, evidence-based policy, and accessible epidemiological reporting.
She is a creative and dedicated content writer who loves turning ideas into clear and engaging stories. She writes blog posts and articles that connect with readers. She ensures every piece of content is well-structured and easy to understand. Her writing helps our brand share useful information and build strong relationships with our audience.